

The study to improve the current method of doing work is called Method Study.

- Time Study
- Work Sampling
- PMTS (Predetermined motion time study)
Out of all these, this article focuses on work sampling.
Understanding work sampling
Work sampling is a fact-finding tool and has the following two main objectives:
- To measure activities and delays while a man is working and the percentage of that he is not working. It means a fair day’s work.
- Under certain circumstances, to measure manual tasks that are to establish time standards for an operation.
In this method, the error is likely to occur, but the error tends to diminish as the number of samples increases.
Simply put, the initial step is to select a “random” worker and observe them in a “random” observation time slot. This random selection is easy if there are 10 or even 20 people. However, it becomes confusing when selecting random people and time slots for more than 100 people working in a unit.
Random number table
For this purpose, an interesting mathematical tool called “Random Number Table” can be used where all members of the population will have an equal and independent chance of being selected for the sample group.
It is a series of digits (0 to 9) arranged randomly in rows and columns. This chart contains grouped numbers (a group of 4 numbers shown in the chart below) which can extend for more than 4 pages!
Note, that you can select any column or row in the table to select random numbers.

You can download the random number table chart here.
The application of random selection can be easily done using this table. Let us select random time slots and then random workers for sampling in simple examples explained below-
Example-1: Using Random Table
A work sampling is to be conducted for 5 workdays, given that the work sampling engineer can work from 9 AM to 5 PM every day; let us choose random minutes to study the workers on day 1.
Total available minutes of study = (8 x 60) = 480 minutes
Minutes can be randomly chosen between 000 and 480

111th minute — 11:01 AM
61st minute —– 11:51 PM
376th minute—- 03:20 PM
320th minute—– 4:16 PM
And so on….
Example-2: Using Random Table
Out of 12 workers choose 5 workers using a random number table.
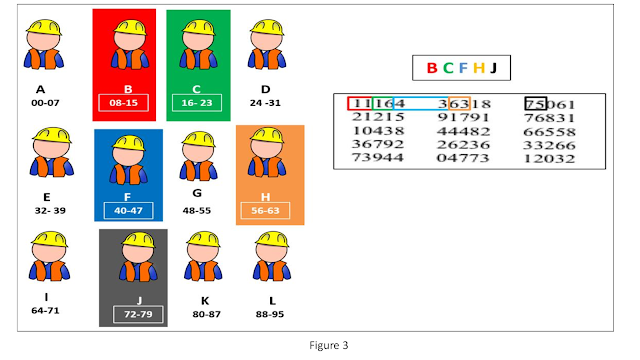
First, we assign all possible 2- digit numbers to the 12 workers between 00 and 99
Total 2-digit numbers = 100
It means we can assign (100/12) = 8 numbers to each worker
Remainder 4 values are assigned to the last four workers (I, J, K, L).
As shown in the figure above, the two-digit numbers are read from the top row of the table and those workers are selected to whom these numbers are assigned. 5 random workers are B, C, F, H, and J.
There are many software for industrial engineers now a days which automatically give out random selection of time slots and people for observation. All of those use the above explained algorithm to give out values. Some applications are even android/iOS friendly having integration with Microsoft excel and keep updating real-time readings.
Microsoft Excel has no built-in function to randomly pick cells in excel, but there are ways to generate random numbers using some functions as explained in the article – How to generate random numbers in Excel – RAND and RANDBETWEEN functions at Ablebits.com
References:
- Introduction to Work Study, 4th revised edition, by George Kanawaty, International Labour Organization
- Article by Nikhila C. – Work Sampling: Objectives, Theory and Applications
- Table of Random Numbers, webpage – MathBitsNotebook.com
- How to generate random numbers in Excel – RAND and RANDBETWEEN functions
- Random number chart by The Rand Corporation, A Million Random Digits with 100,000 Normal Deviates (New York Free Press,1955
About the Author:
Aayushi Kumar, an NIFT, Kolkata graduate, and Co-founder of Ednam Solutions Pvt Ltd is working in the field of female healthcare and hygiene, making smart garment.
Her interests include sustainable fashion, functional garments and luxury brand management.


Leave a Reply